US ETF inflows are within 1.34% of last year's record
US-listed ETFs are close enough to last year's full-year inflow record that the story is no longer about timing. It is about where the fee base is moving, and how much of that movement is real demand versus mechanical flow.
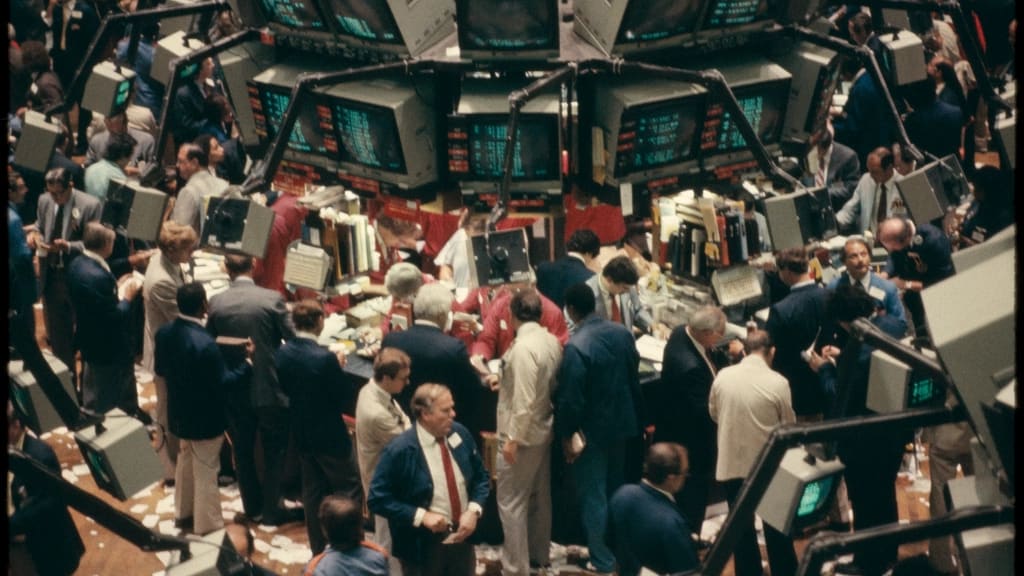
US-listed ETFs have nearly matched last year's full-year inflow record with more than a quarter of the calendar still open. ETF.com put year-to-date inflows at about $1.47 trillion after $91.88238 billion entered US-listed ETFs in the week ended Sept. 18. FactSet put the prior full-year record at $1.49 trillion for 2025. The gap is $20 billion, or 1.34%, calculated as $1.49 trillion minus $1.47 trillion equals $0.02 trillion, and $0.02 trillion divided by $1.49 trillion equals 0.0134, or 1.34%. That is the thesis: the ETF wrapper is no longer just winning share over time; it is absorbing new money at a pace where last year's record is functionally the baseline.
Context
The latest flow story sits inside a strange market week. The Federal Reserve raised its target range by 0.25 percentage point, calculated as a 25 basis point move divided by 100 basis points per percentage point. That would normally be an argument for caution around equity duration and valuation. Instead, ETF demand stayed broad. ETF.com reported $91.88238 billion of total weekly inflows, calculated from its asset-class table as $61.19208 billion in US equity plus $10.31821 billion in US fixed income plus $9.49586 billion in international equity plus $3.56372 billion in international fixed income plus $3.26149 billion in alternatives plus $2.64846 billion in commodities plus $1.18091 billion in leveraged funds plus $0.37290 billion in asset allocation plus $0.12577 billion in inverse funds minus $0.27702 billion in currency funds.
There is a useful cross-check. ICI reported estimated ETF net issuance of $26.606 billion for the week ended Sept. 16. Its total is calculated as $14.773 billion of equity ETF net issuance minus $0.012 billion of hybrid ETF net issuance plus $9.721 billion of bond ETF net issuance plus $2.124 billion of commodity ETF net issuance, which equals $26.606 billion. ETF.com and ICI are not measuring the same exact window or the same dataset cut, so the $65.276 billion difference, calculated as $91.882 billion minus $26.606 billion, is not a contradiction. It is a reminder that weekly flow numbers are estimates, not a settlement statement from the sky.
A second market source points even further. ETF Daily, citing VettaFi flow data through Sept. 18, said US-listed ETFs had taken in $1.51 trillion, already above the $1.49 trillion 2025 record. On that measure, the excess is $20 billion, calculated as $1.51 trillion minus $1.49 trillion, again equal to 1.34% of the old record because $0.02 trillion divided by $1.49 trillion equals 0.0134. The exact crossing date depends on provider methodology. The direction does not.
The analysis
The first point is scale. ETF.com's $1.47 trillion year-to-date number is 98.66% of FactSet's $1.49 trillion 2025 record, calculated as $1.47 trillion divided by $1.49 trillion equals 0.9866. A flow total that close to the old record before the fourth quarter changes the question from whether ETFs are taking share to how much of the asset-management fee pool is being repriced into ETF form.
The second point is concentration. ETF.com's weekly data show US equity ETFs took in $61.19208 billion of the $91.88238 billion total. That is 66.60% of weekly flows, calculated as $61.19208 billion divided by $91.88238 billion equals 0.6660. In plain English, about two-thirds of the reported week went into US equity ETFs. ETF Daily's VettaFi-based story shows concentration at the fund level too: VOO gathered $147.4 billion, SPYM gathered $58.7 billion, and VTI gathered $50.8 billion year to date. Together, those three funds gathered $256.9 billion, calculated as $147.4 billion plus $58.7 billion plus $50.8 billion. Against VettaFi's $1.51 trillion industry total, that is 17.01%, calculated as $256.9 billion divided by $1.51 trillion.
The third point is cost. Flow records are not only a scoreboard for issuers; they are a running bill for investors. The iShares Core S&P 500 ETF lists a 0.03% expense ratio. The SPDR S&P 500 ETF Trust lists a 0.0945% gross expense ratio. On a $100,000 holding, 0.03% costs $30 per year, calculated as $100,000 times 0.0003. On the same $100,000 holding, 0.0945% costs $94.50 per year, calculated as $100,000 times 0.000945. The annual difference is $64.50, calculated as $94.50 minus $30. Scaled to the ETF.com year-to-date inflow base, a 0.03% fee rate on $1.47 trillion would equal $441 million a year, calculated as $1.47 trillion times 0.0003. A 0.0945% fee rate on $1.47 trillion would equal $1.38915 billion a year, calculated as $1.47 trillion times 0.000945. The difference is $948.15 million a year, calculated as $1.38915 billion minus $441 million.
That last calculation is not a claim that all new ETF money is going into one index product or one fee tier. It is a fee sensitivity exercise. When flows get this large, small expense-ratio differences become large dollar amounts. The wrapper's victory is partly about access and tax mechanics, but it is also about price transparency. Investors can now see the cost line clearly enough to compare it.
Risks and counterpoints
The main risk is that the flow record is overstating durable demand. ETF.com itself noted that quarterly rebalancing, tax management, and distribution-related trades distorted individual-fund numbers. If a large part of the $91.88238 billion weekly inflow reverses, then the conclusion that current demand is as strong as the headline suggests weakens. The assumption that would break the analysis is this: year-to-date ETF inflows are mostly persistent asset allocation, not temporary creation and redemption activity.
A second risk is provider methodology. ETF.com, FactSet, ICI, and VettaFi do not publish identical numbers because timing, fund universes, and revisions differ. The analysis depends on the broad agreement that the 2026 run rate is near or above the 2025 record. If revised data later put year-to-date flows materially below $1.47 trillion, the $20 billion gap calculation would no longer carry the story.
A third counterpoint is market exposure. Large inflows into low-cost index ETFs can still buy expensive assets. A cheap expense ratio does not make the underlying stocks cheap. The fee math is reliable because $100,000 times 0.0003 equals $30, but the return path is not reliable because market prices move for reasons the fee line does not control.
What to do with it
Treat the flow record as evidence of structure, not as a signal to chase a ticker. The useful action is to audit the wrapper. Compare the index tracked, holdings overlap, bid-ask spread, tax profile, and expense ratio. A 0.0645 percentage point fee gap, calculated as 0.0945% minus 0.03%, equals $64.50 per $100,000 per year because $100,000 times 0.000645 equals $64.50. That is not a forecast. It is arithmetic.
The broader read is that ETFs have become the default implementation layer for a growing share of public-market exposure. That can be good for fee competition and transparency. It can also make flows look smoother than the investor behavior underneath them. The open question is not whether ETFs are important. The open question is how much of this year's record pace is durable savings behavior, and how much is market plumbing that will reverse when rebalancing season passes.
Sources
- ETF.com - A Record ETF Year Takes Shape as Inflows Near $1.5 Trillion
- FactSet - U.S. ETF Summary: December and Full Year 2025 Results
- Investment Company Institute - Estimated ETF Net Issuance
- ETF Daily - Three funds are carrying the ETF industry's record year
- Federal Reserve - September 16, 2026 FOMC statement
- iShares - iShares Core S&P 500 ETF fees
Disclaimer. This is editorial analysis, not investment advice. No security mentioned here is an offer to buy or sell. Past performance does not guarantee future results — decide based on your own situation, time horizon and risk tolerance.

BlackMoney Desk
ETFs & FundsWrites for BlackMoney. Open math, named risks, no hot tips.
Comments
0 commentsNo comments yet. Yours could be the first.